


产品中心

Nexera Method Scouting System 全方位的方法探索系统
- 商品名称: Nexera Method Scouting System 全方位的方法探索系统
- 型号: Nexera Method Scouting System
- 名称: Nexera Method Scouting System 方法探索系统
- 品牌: 日本岛津
- 应用领域: Nexera Method Scouting System 采用专用控制软件 Method Scouting Solution与高耐压·耐用的柱切换系统,自动切换流动相与色谱柱,实现快速可靠的方法探索流程。有力支持HPLC方法开发。
- 产品描述
-
Improving Efficiency of the Entire Method Development Workflow

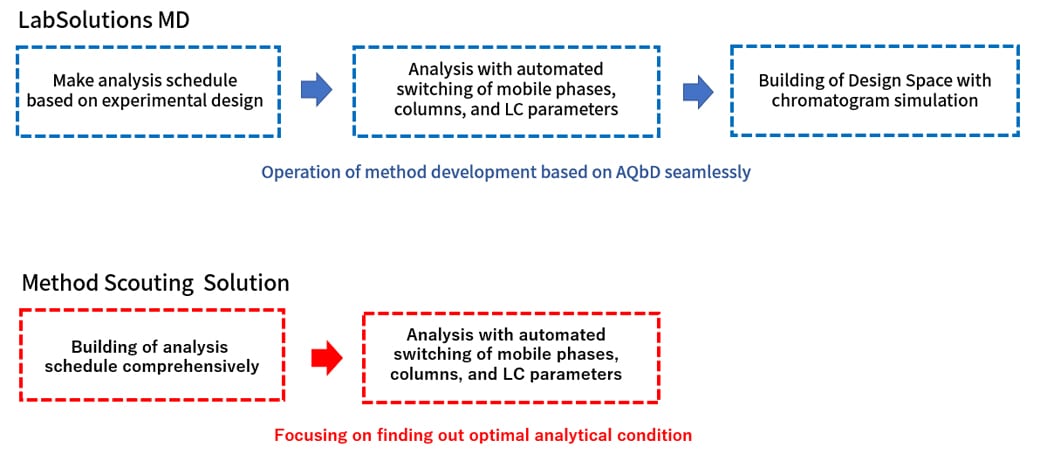
LabSolutions™ MD improves method development efficiency by taking an Analytical Quality by Design (AQbD) approach. This software efficiently develops highly reliable analysis methods by configuring mobile phases, columns, and other parameters using an analysis function that automatically generates analysis schedules with the experimental design method and a data analysis function that plots a design space and predicted chromatogram.

Optimization
Reduce the Number of Data Points Using Experimental Design
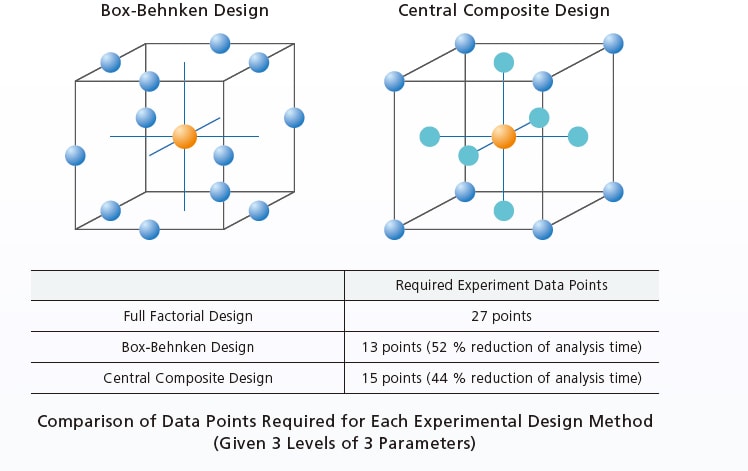
Box-Behnken design and central composite design can shorten analysis times because they require fewer data points than full factorial design. For example, if determining the three optimal levels for the organic mobile phase mixture ratio, pump gradient conditions, and column oven temperature, full factorial design requires 27 data points (3 × 3 × 3) for optimization whereas Box-Behnken design requires 13 points and central composite design requires 15 points.
Easily Creates Analysis Schedules with Experimental Design
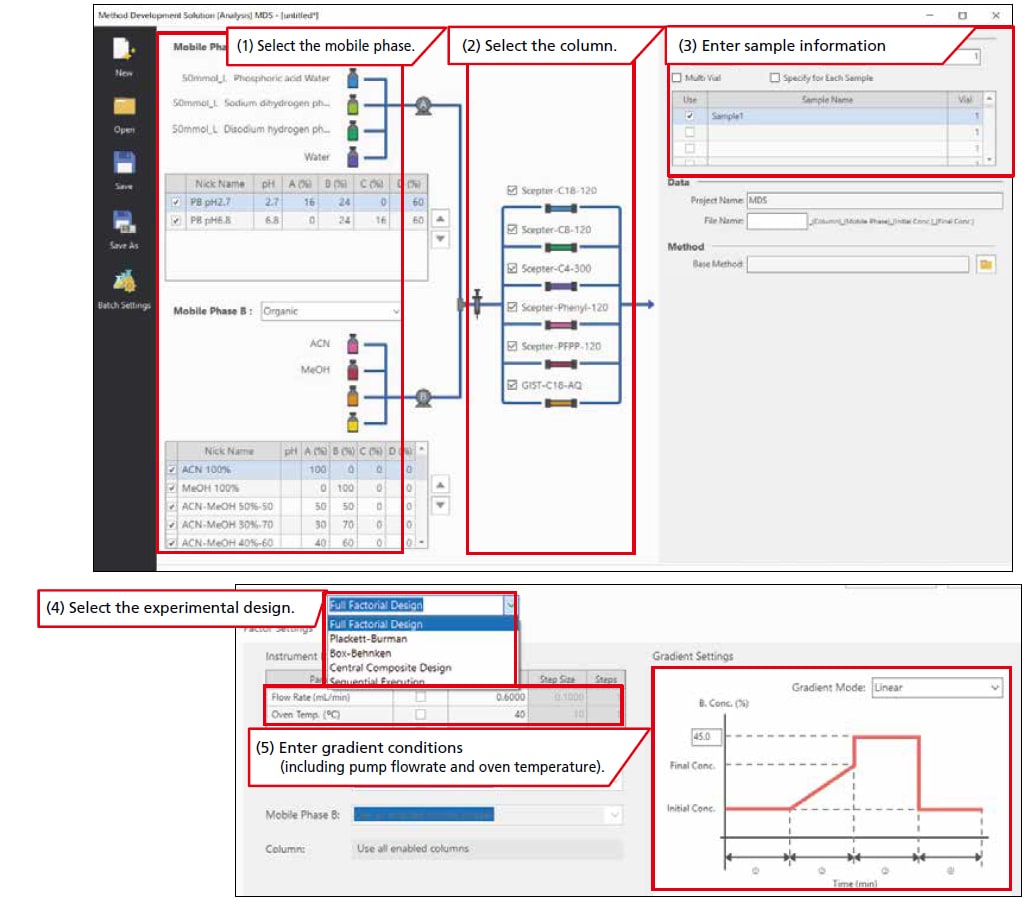
The process of creating the vast number of method files and analysis schedules required for screening can be completed quickly by simply following steps (1) to (5) below. The mobile phase and column can be selected with a single click and a comprehensive schedule reflecting column equilibration and blank analysis is generated automatically. In addition to improved operational efficiency, this process can reduce human errors. The experimental design can also be selected with a single click.
Easy Creation of Analysis Schedule
Quickly Find Optimal Condition
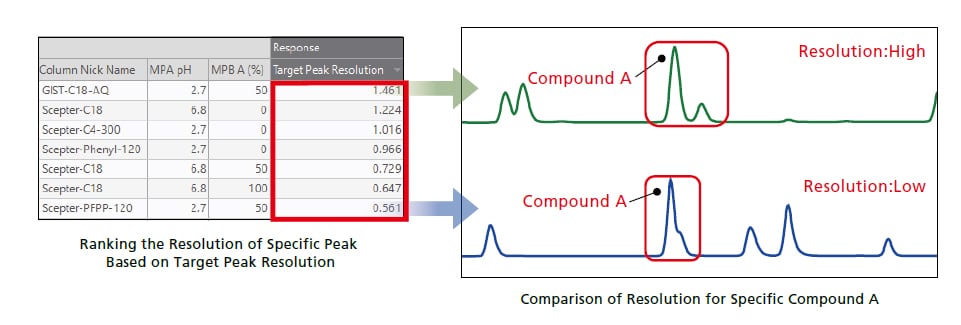
Because screening generates as many chromatograms as the number of conditions considered, they must be evaluated to determine which is optimal. If all the chromatograms had to be scrutinized by a human, it would be very tedious. LabSolutions MD can quickly and easily find optimal analytical conditions using equation (1) below to quantitatively evaluate the separation status resulting from each analytical condition.
*Method Scouting Solution can be used in conjunction with optional software multi-data reporting.
E = P×(Rs1+Rs2+…RsP) … (Eq. 1)
The evaluation value (E) is calculated as the number of peaks detected (P) multiplied by the sum of the separation level (Rs) for all peaks.
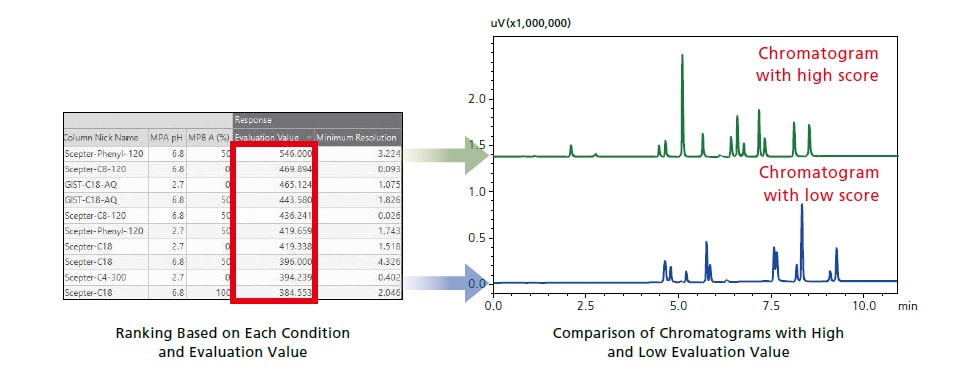
Target Peak Resolution can be used to evaluate the resolution on a specific peak while Evaluation Value considers all the peaks detected.
Identify the Most Robust Analytical Condition by Design Space

Visualize the Most Robust Analytical Conditions by Design Space
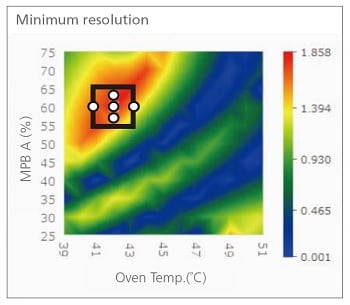
After the pH level of the aqueous mobile phase and column are selected in the screening phase, analytical conditions are further optimized by considering the mixture ratio of the organic mobile phase (30, 40, 50, 60, 70 %), oven temperature (35, 40, 45 °C), and final concentration of gradient program (75, 80, 85 %). The effect these these parameters have on separation is shown in the design space with the mixture ratio of organic mobile phase on the vertical axis and oven temperature on the horizontal axis.

Overlaying the design spaces makes it evident that the optimal analytical conditions are as follows: organic solvent mixture ratio of 60 %, column oven temperature of 42 °C, and gradient final concentration of 75 %. It is possible to search not only for the degree of separation and the symmetry factor, but also the optimal analytical conditions considering the analysis time. Robust analytical conditions can be specified without relying on intuition or experience by utilizing design space.
Simulation of Chromatogram
By clicking any point in the design space (e.g. point A : blue square in the black circle), a simulated chromatogram can be displayed. This function allows quickly checking how the separation will change without running an analysis.

* Mobile Phase B A: Mobile phase A (acetonitrile) from Pump B
The black dots in the figure are points where the analysis was implemented.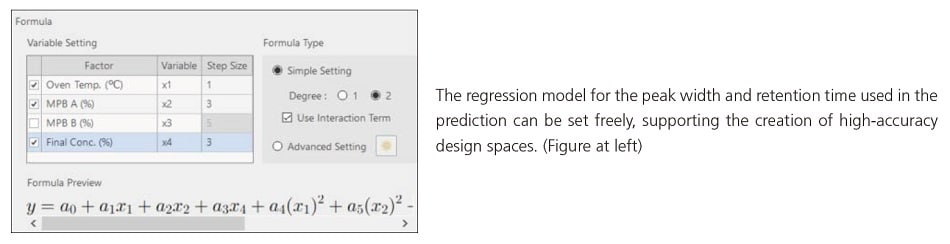
Evaluating Robustness Using Iterative Experimental Design
LabSolutions MD can create a sequential experimental design to perform robustness evaluation. Robustness evaluation is important to understand how variations in parameters will affect results and ensure the reliability of methods. LabSolutions MD create a sequential experimental design automatically by changing the parameters of an optimized method in a small range to evaluate the robustness. In this example, the mixture ratio of organic mobile phase was changed by 1 % (59, 60, 61 %) and oven temperature by 1 °C (41, 42, 43 °C) (white circles in the right figure) to verify the effect on separation.
Below shows chromatograms obtained for robustness evaluation. Varying the parameters showed little effect on separation, showing robustness of the optimized method constructed by design space.
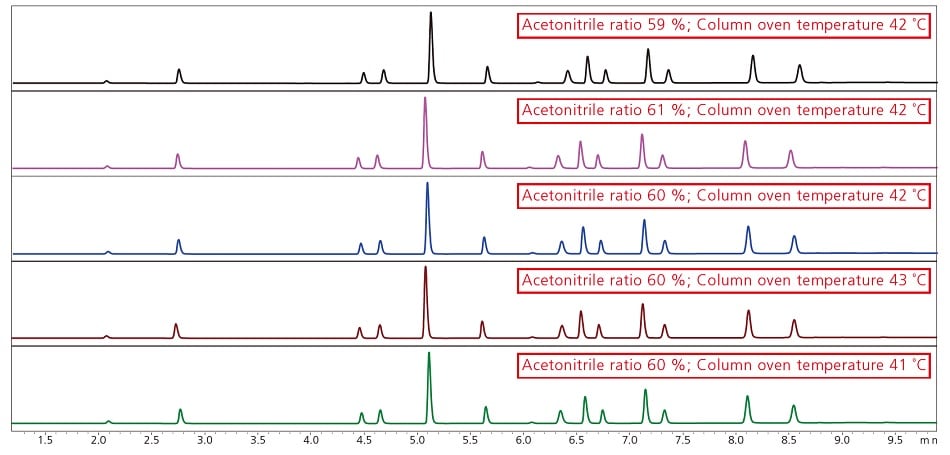
Chromatograms Obtained at Each Robustness Validation Data Point
Automatic Identification of Compounds by Peak Tracking (i-PeakTracer™)
i-PeakTracer automatically sets the parameters for peak tracking to make it effortless for anyone to track peaks through all the data.

Ensure Data Integrity by Database Management
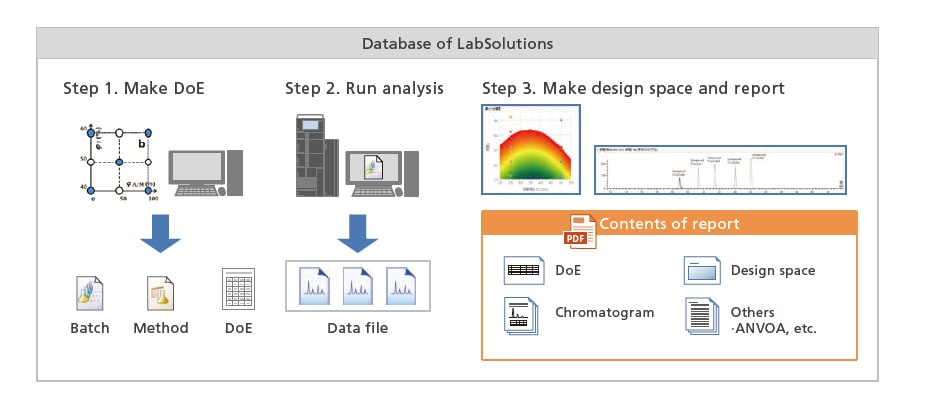
It is easy to check analysis results using LabSolutions MD because all associated information, such as the experimental design, design space, and chromatograms, are output in a report. It also ensures data integrity by managing outputted reports together with the corresponding experimental design file, method file, batch file, and data file within a LabSolutions database.
Due to the seamless integration of all process steps, including creating an experimental design, acquiring data, and all method development steps in the design space, LabSolutions MD eliminates the need for any time-consuming file importing or exporting steps.
Automatic Optimization of Gradient Conditions
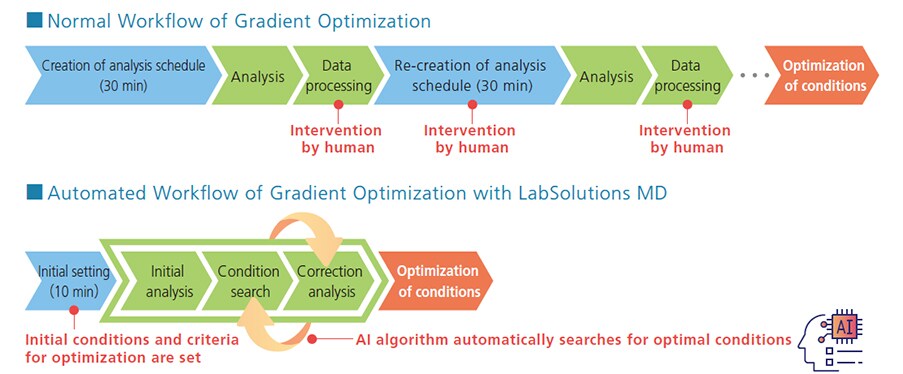
AI Algorithm Automatically Optimizes Gradient Conditions
LabSolutions MD has a unique AI algorithm for automatic optimization of gradient conditions. By setting resolution criteria, it automatically searchs for the gradient conditions that meet the criteria.In a normal method development workflow, human intervention is required for creating analysis schedules and performing data analysis. In contrast, LabSolutions MD automatically generates and registers improved gradient conditions based on the data obtained, enabling exploration and optimization of gradient conditions without human intervention.
Setting of Resolution Criteria for Automatic Optimization
By setting initial conditions of gradient curves and resolution criteria, the gradient conditions that meet the criteria can be automatically searched.
With AI-driven automatic exploration, anyone can search for the conditions regardless of their chromatography experience.
Application to Functional Components in Food
A case study demonstrates the application of automatic optimization of gradient conditions in the simultaneous analysis of catechins and theaflavins below. At first, the resolution between G1 and C1 as well as T1 and T2 (highlighted in red in the figure) was not enough. However, by using AI to conduct a series of searches, gradient conditions meeting the criteria (minimum resolution: 1.5) were automatically discovered (highlighted in green in the figure). The blue lines in the figure represent the gradient conditions for each analysis.
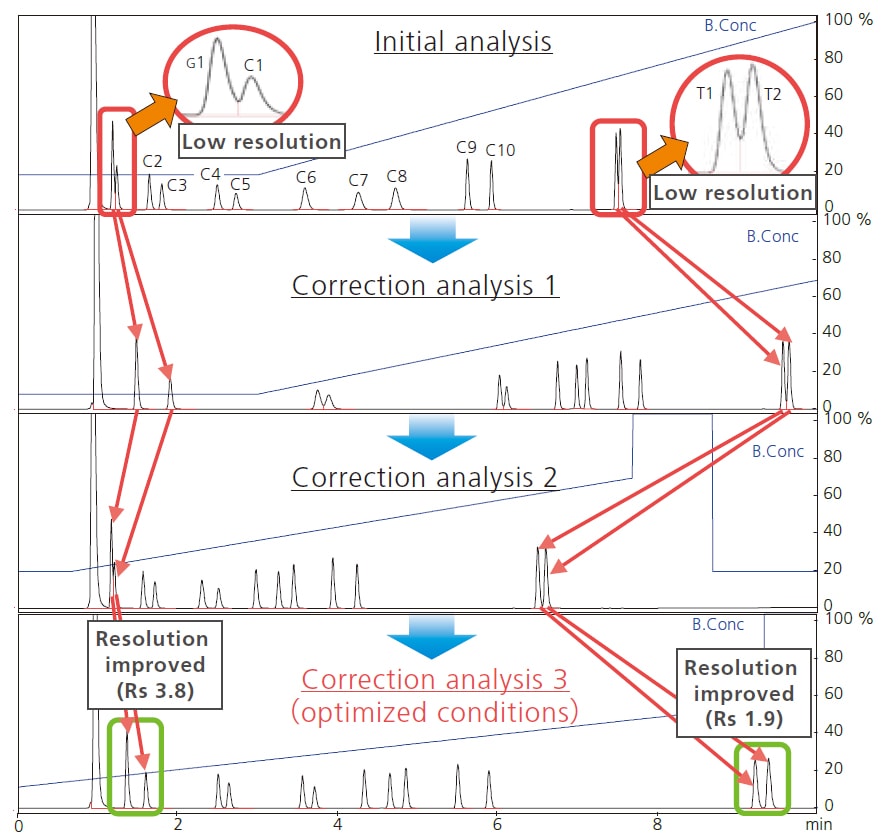
Automatic Gradient Optimization by AI(catechin and theaflavin)
Automated Column and Mobile Phases Switching
Nexera™ Series
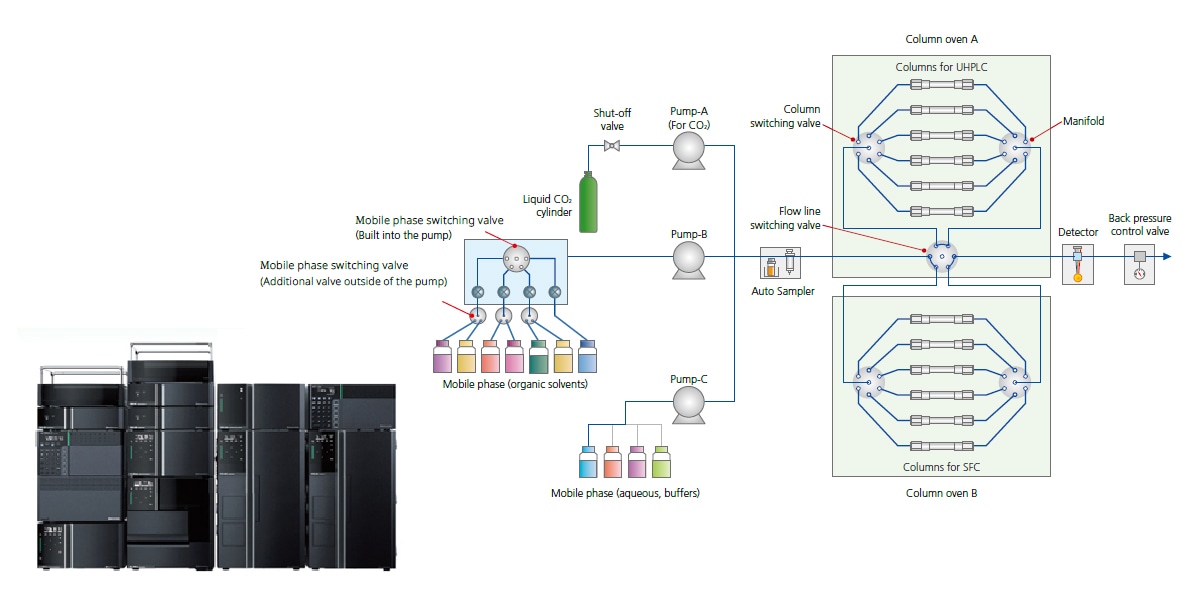
These ultra high performance liquid chromatographs have a maximum pressure capacity of 130 MPa and support up to 192 combinations of 8 types of mobile phases and 12 types of columns (4 × 4 × 12).

i-Series
These space-efficient and cost-efficient integrated LC systems support pressures up to 70 MPa.

Supercritical Fluid Chromatograph Nexera/UCs UHPLC/SFC Switching System
- Optimized for method investigation of chiral compounds
- Also compatible with LC/SFC switching, and can investigate various separation modes
Automated Mobile Phase Blending
The mobile phase blending functionality can dramatically reduce the amount of time previously required for mobile phase preparation by automatically preparing mobile phases with the user-specified pH level or the organic mobile phase mixture ratio using only a few types of mobile phases prepared in advance. i-Series systems can use a low-pressure gradient to blend up to two types of aqueous and two types of organic mobile phases.

Automatic Mobile Phase Preparation Using the Mobile Phase Blending Functionality
(in Nexera systems configured with high-pressure gradient capability)Maximizing Productivity with LCMS-2050

The LCMS-2050 is a single quadrupole MS that combines revolutionary technology with the ease of use as an LC detector. This system features a wide mass range (m/z 2 to 2,000), a quick start as fast as six minutes, and easy, tool-free maintenance. It can fit into basic LC systems with its space saving design. For details, refer to the catalog “LCMS-2050 Liquid Chromatograph Mass Spectrometer (C146-E442)”.